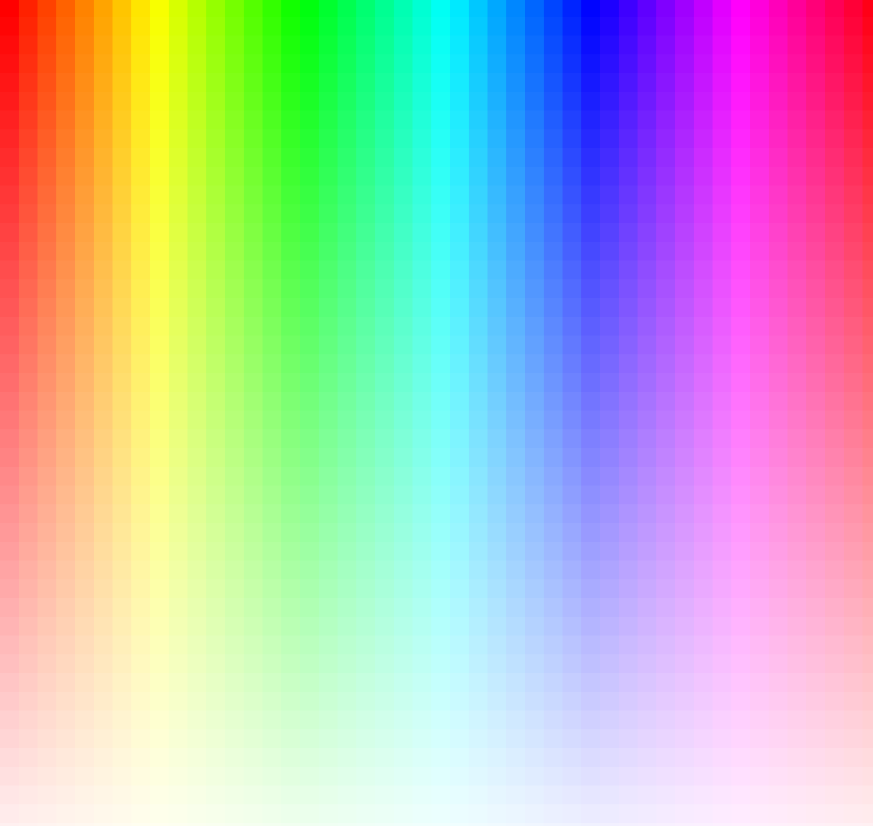
Looped HSB
A full-windowed canvas displaying the HSB Colour Model has been made to understand the difference between RGB and
HSB as well as how to utilise it appropriately.
To program this, the colorMode() must be set to HSB while its hue and saturation are determined by the width and height of the canvas. A nested for() loop is then created to evenly spread out the colours.
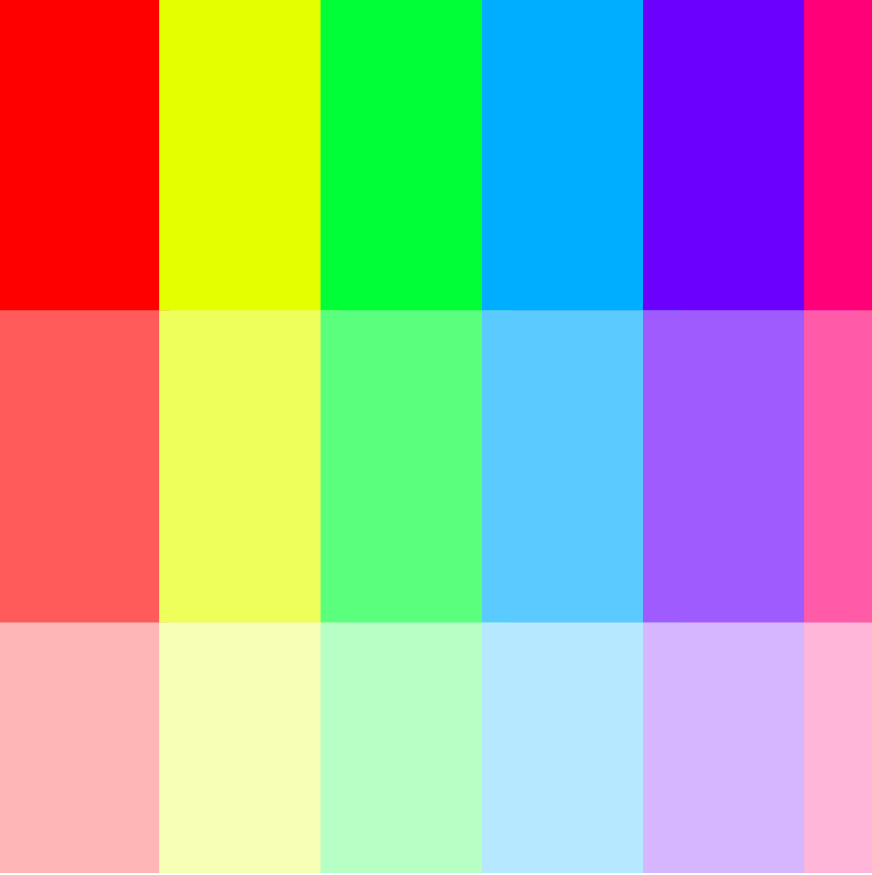
Interactive Looped HSB
Identical to the previous demonstration above however, this project replaces the static HSB canvas to follow the mouse cursor. Through the user's interactivity,
this results in changing the scale of the canvas.
This is done by modifying the stepX and stepY variables to follow mouseX and mouseY. By doing this, the nested for() loop will then take the user's mouse cursor into consideration.
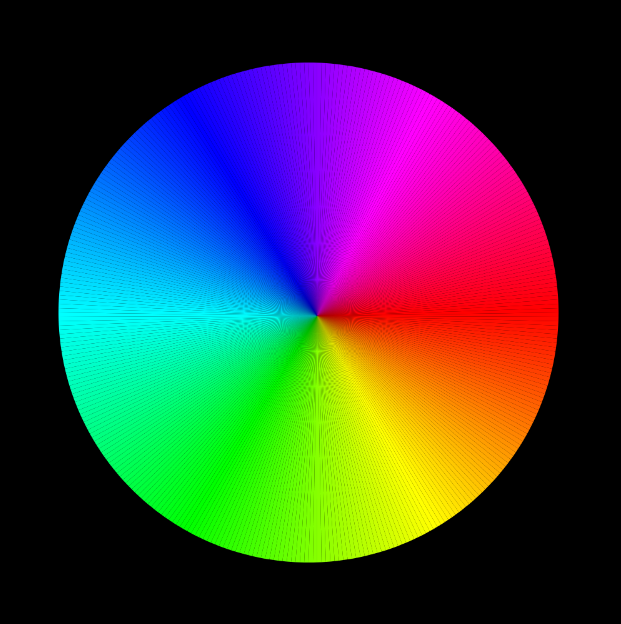
Radial Fan
Similar objective to the projects above, this however, displays the HSB Colour Model in a radial manner.
This colour wheel is developed by utilising p5.js beginShape(TRIANGLE_FAN) and endShape() functions.
In between those two functions, the calculations of the coordinates is done by getting the sine & cosine of the angle then multiplying it by the preferred radius (i.e. let vx = radius * cos(a) + 250).
The variables vx and vy are then placed within the vertex() to create the radial fan. The variable for the angle is placed within the hue value of the fill() to display the HSB in a radial manner.
Basic Translations
Stepping aside from the colour theory, this project's purpose is a refresher on the basics of translate(), push() and pop().
Live Demo
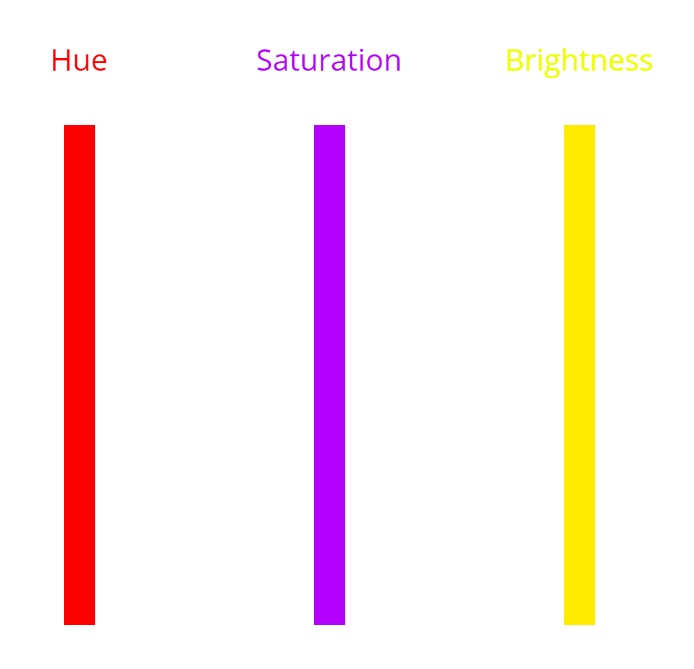
HSB Colour Tool
Using the practices of HSB and translations, this project consists of a simple
interactive canvas tool. This tool will then help the user to understand the HSB Colour Model.
The radial wheel is developed using the methods from the Radial Fan project however, the updating of colour is done by placing the mouseX within the fill() of the triangle fan (i.e. fill(mouseX - a, mouseX, 100)).
Multiple mapped variables are also used to time the updates of each objects depending on where the user's mouse cursor is. For example: let slowChangeH = map(mouseX, 600, width, 0, 360) =
once the user's cursor passes 600px on the x-axis of the canvas, begin to update the HSB values of the "hue" rectangle.
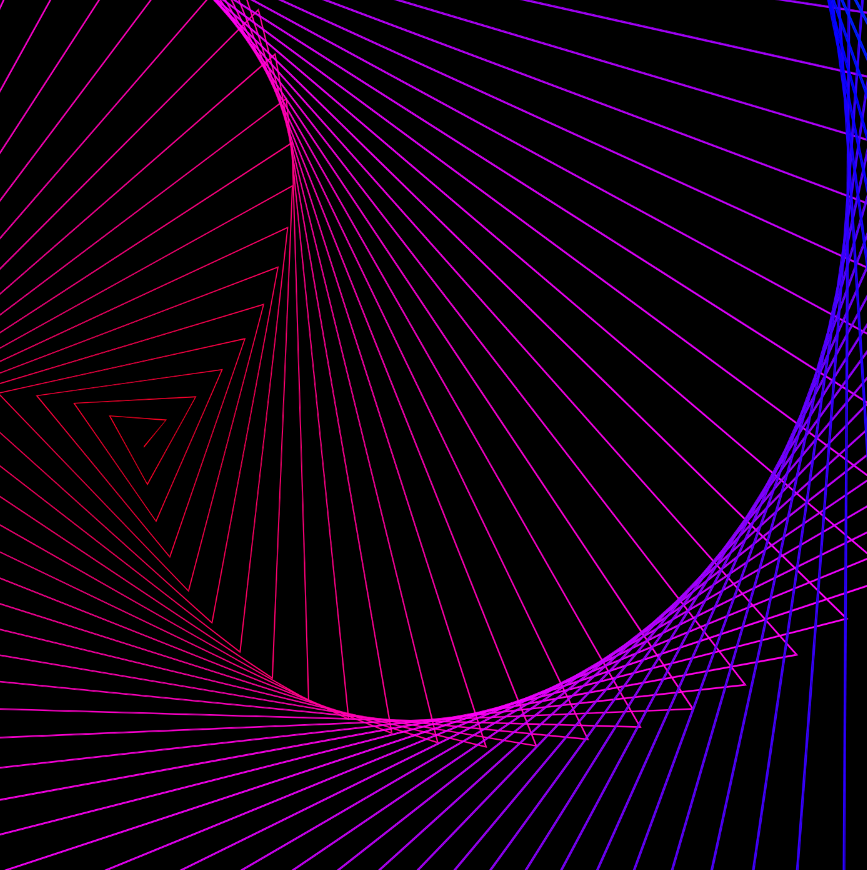
Interpolation
This abstract animated canvas displays the interpolation of colours by using the P5.js function lerpColor(). The user may change the interpolation ranges by moving their mouse cursor within the canvas.
The spiral effect is developed by utilising beginShape() once again but with TRIANGLE_STRIP. Two spirals are created with their own inner and outer shapes. These are then animated by creating a rotation speed variable which is then used within the sine and cosine of each spirals to generate a new point per frame. These points are the cause of the abstract patterns.
By adding a time global variable then updating that variable by adding 0.005 seconds, this will then animate the spiral. To interpolate the colours, the starting & ending ranges are first mapped then placed within the fill() of the spirals.